After a Collision Safety Precautions for Electric Vehicles
Maintenance and Safety of Electric Vehicles
Maintenance and Safety of Electric Vehicles

PHEVs and HEVs require the same general maintenance as conventional vehicles, but all-electric vehicles require less maintenance because they have fewer moving parts and fluids to change.
Maintenance needs and safety requirements for plug-in hybrid electric vehicles (PHEVs) and hybrid electric vehicles (HEVs) are similar to those of conventional vehicles, while all-electric vehicles require less maintenance. Manufacturers are designing these vehicles and publishing guides with maintenance and safety in mind.
Maintenance Comparison
Because PHEVs and HEVs have internal combustion engines, maintenance requirements are similar to those of conventional vehicles. The electrical system (battery, motor, and associated electronics) typically requires minimal scheduled maintenance, and brake systems generally last longer than those on conventional vehicles because of regenerative braking.
All-electric vehicles typically require less maintenance than conventional vehicles because:
- The battery, motor, and associated electronics require little to no regular maintenance
- There are fewer fluids, such as engine oil, that require regular maintenance
- Brake wear is significantly reduced due to regenerative braking
- There are far fewer moving parts relative to a conventional fuel engine.
Battery Maintenance
The advanced batteries used in these vehicles have a limited number of charging cycles (the number of times the battery can be charged and discharged, also called "cycle life"). Check with the dealer about battery life and warranties and consider the manufacturer's battery recycling policy. Some automotive battery systems use liquid coolant to maintain safe operating temperatures. These systems may require regular checks. Ask your dealer or refer to your owner's manual for more information.
The batteries in electric-drive vehicles are generally designed to last for the expected lifetime of the vehicle. Like the engines in conventional vehicles, the advanced batteries in electric vehicles (EVs) are designed for extended life but will wear out eventually. While comprehensive data on EV battery failures is not available, many manufacturers offer 8-year/100,000-mile warranties for their EV batteries.
Manufacturers typically do not publish pricing for replacement batteries, but if the battery does need to be replaced outside the warranty, it is expected to be a significant expense. However, battery prices are expected to decline as technology improves and production volumes increase.
Safety Requirements
Commercially available electric-drive vehicles must meet the Federal Motor Vehicle Safety Standards and undergo the same rigorous safety testing as conventional vehicles sold in the United States. The exception is low-speed electric vehicles (also called neighborhood electric vehicles), which are subject to less-stringent standards because they are typically limited to low-speed roadways as specified by state and local regulations.
All-electric vehicles, PHEVs, and HEVs have high-voltage electrical systems that typically range from 400 to 1,000 volts. Their battery packs are encased in sealed shells and meet testing standards that subject batteries to conditions such as overcharge, vibration, extreme temperatures, short circuit, humidity, fire, collision, and water immersion. Manufacturers design these vehicles with insulated high-voltage lines, and light-duty vehicles are required to have safety features that can deactivate or isolate the electrical system when they detect a collision or short circuit. All-electric vehicles tend to have a lower center of gravity than conventional vehicles, making them more stable and less likely to roll over.
Emergency Response and Training
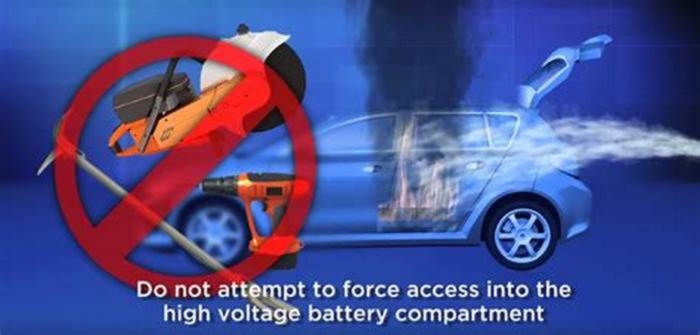
In general, emergency response for electric-drive vehicles is not significantly different from that of conventional vehicles. Most electric-drive vehicles are designed with cutoff switches or have available methods for first responders to isolate the battery and disable the electric system, and high-voltage power cables typically are clearly designated with distinctive coloring or markings (usually orange).
Many manufacturers publish emergency response guides for their vehicles (see an example from the National Fire Protection Association), and first responders are highly encouraged to reference these guides. The National Fire Protection Association also has training and information resources available at evsafetytraining.org.
Electric vehicle fires involving the high-voltage battery can present unique challenges to firefighters, often requiring different techniques. First responders should refer to the manufacturer guides and training resources noted above when responding to an electric vehicle incident or fire and should also be aware of the potential for delayed ignition of a damaged vehicle or reignition of a battery fire, even after it is believed to be extinguished.
%PDF-1.4%526 0 obj<>endobj xref526 240000000016 00000 n0000001691 00000 n0000001837 00000 n0000001880 00000 n0000002158 00000 n0000002416 00000 n0000002957 00000 n0000002994 00000 n0000003263 00000 n0000003615 00000 n0000003864 00000 n0000004449 00000 n0000005261 00000 n0000006018 00000 n0000006619 00000 n0000007380 00000 n0000008045 00000 n0000008709 00000 n0000009492 00000 n0000010051 00000 n0000010863 00000 n0000025135 00000 n0000001502 00000 n0000000791 00000 ntrailer<<7A562CE301581B4F8E46CA47B55735B3>]/Prev 151604/XRefStm 1502>>startxref0%%EOF 549 0 obj<>streamhb```b``Ic`e``g`@ 6vP7Wsjr:zqG30<6'*2q0nrR9UF[> On's( 65ae o@!YINj&b8oNBKKzDOJ(>^,)1374:3|[TCd%9*^X(`3bZ/bZ`kOLp`,)e(T:2s^c7!FAg]s=E (J 4,[YN)FA"t!@eL@Z}%T{(8062,nx#@!a}7B>3p** zL8�f0>`y 0QM ,gcd` .op`c00(Vc`/y
Electric and Hybrid Vehicles
Battery-electric vehicles use battery packs to store energy and utilizes the electric motor to move the vehicle. These battery packs could last the lifespan of the vehicle, but there are many factors that could affect how long a battery lasts, according to FuelEconomy.gov and predictive modeling by the Department of Energy's National Renewable Energy Laboratory.
Most modern electric vehicle battery packs employ some form of lithium-ion chemistries, such as NMC (Nickel Manganese Cobalt) or NCA (Nickel Cobalt Aluminum); these battery chemistries use more costly materials that offer greater driving range. Another lithium-ion chemistry, Lithium Iron Phosphate (LFP), uses less costly materials that offer a moderate range with a longer cycle life.
Batteries and Temperature
EV battery packs include interconnected cells, hardware, and software to manage the batterys operation; this is referred to as the battery management system. Temperature control is important for batteries, as extreme temperatures can affect performance and shorten a batterys lifespan. Thermal management systems keep the batteries within the pack at an optimal temperature even in harsher environments but this can negatively affect your driving range since some of the batterys energy is used for thermal management instead of motor use.
Battery and Flooding
Batteries in hybrid and electric vehicles are highly corrosive and should not be exposed to standing water. Flooded vehicles lead to high-voltage shock hazards, which could lead to a fire. If your EV has been exposed to flood conditions and you suspect your battery is damaged, contact your dealer and/or emergency services.
Charging
Today, many electric vehicles have a driving range of around 300 miles on a full charge, while some have a driving range upwards of 400 miles on a single charge. When the batterys charge is low, the EV needs to plug into an electric power source to replenish the batterys charge this can occur at home, work, or any other public location along your route. However, not all vehicles and charging stations charge at the same rate. DC fast chargers can replenish your batterys charge in under an hour, while at-home chargers may take all night to recharge your battery.
Always follow the owners manual and the manufacturers instructions regarding charging safety protocols, maintenance requirements, and related operations.
Charging Resources
Before driving an EV, its important to familiarize yourself with charging stations their level of charging, plug type, and location. The U.S. Department of Transportation offers more information on electric vehicle charging speeds and plug types. Understanding EV chargers and knowing their locations along your route will help you plan when driving an electric vehicle. The U.S. Department of Energy offers more information on electric vehicle charging station locations.
Exploration of the characteristics and trends of electric vehicle crashes: a case study in Norway
Identification of important factors that affect crash severity is essential to formulate appropriate countermeasures. In this section, two logistic regression models are established to determine the statistically significant factors that affect crash severity (i.e., light vs severe) for ICEVs and EVs, respectively.
Table8 lists a summary of variables used in regression analysis to crash severity. Some variables are recategorized to balance sample sizes in each category without losing the representativeness. Only crashes with definite values for these variables are adopted here. Out of the total 35,441 ICEV and 342 EV crashes, 28,442 and 278 of them are kept in the following regression analysis, occupying 80.2% and 81.3% of the raw data, respectively.
The explanatory variables mainly include time factors (day of week, time of day), location factors (settlements, speed limit, roadway location, and the presence of median), environmental factors (visibility and road surface conditions), and crash partner factors (accident category). Based on the findings in the last section, many variables are redefined. For time indicators, day of week is reclassified into weekday and weekend to reflect distributions of crashes on weekdays and weekends; time of day is reclassified into four types: AM peak (78a.m.), daytime (9a.m.2p.m.), PM peak (35p.m.), and nighttime (6p.m.6a.m.), to reflect distributions of crashes over hours; for accident category, bike and pedestrians are merged as non-motorized objects.
The estimated results of logistic regression analysis to crash severity for ICEVs and EVs are shown in Table9. Overall, the results show that most explanatory variables are statistically significant for ICEV crashes, but not for EV crashes. Interpretations of the model results are detailed below.
4.1 Time factors
Weekend shows the significantly positive effect for ICEV crashes but is statistically insignificant for EV crashes. That is, ICEV crashes on weekends are generally more severe than those on weekdays. The possible explanation is that ICEV crashes might mainly occur in the short-distance low-speed commuting travels on weekdays, but in the long-distance high-speed discretionary travels on weekends. However, due to the range limitation, EVs are used few in long-distance travels [36]. Therefore, no matter on weekdays or weekends, EVs are mainly used for short-distance local travels. Thus, EV crashes might not show statistically significant differences in severity by day of week.
Besides, AM peak, PM peak, and nighttime show statistically insignificant, significantly negative, and significantly positive effects on the severity of ICEV crashes, respectively. It is thought that congestions at PM peaks might deter the occurrence of high-speed collisions, while nighttime driving often accompanies with fatigue, impaired drivers, speeding, and so on. However, none of them show significant effects on the severity of EV crashes. As shown above, EVs are mainly used at rush hours. This finding implies that at PM peaks, travel patterns of EVs might be different from ICEVs.
4.2 Location factors
Settlements show significantly positive effects on the severity of ICEV crashes. That is, ICEV crashes are more severe in rural areas, probably because vehicles travel faster on rural roadways.
The low-and high-speed limit indicators show significantly negative and positive effects on ICEV crashes, respectively. That is, compared to middle-speed roadways, ICEV crashes are less severe on low-speed roadways but more severe on high-speed roadways. It is reasonable as crash severity is expected to increase with the increase of speed [37].
Meanwhile, the junction coefficient is significantly negative for ICEV crashes. That is, crashes occurring at segments are more severe than those at junctions. A possible explanation is that at junctions, such as exits, roundabouts, intersections, vehicles might be more likely to run at low speeds. None of these indicators are statistically significant for EV crashes.
The presence of medians shows significantly negative effects on the severity of both ICEV and EV crashes. That is, crashes occurring on roadways with medians are generally less severe, probably because medians prevent vehicles running into the opposite direction to avoid severe head-on crashes. Further exploration indicates that for ICEVs, proportions of head-on crashes in total crashes occurring at roadways with and without medians are 1.5% and 14.9%, respectively; for EVs, proportions of head-on crashes in total crashes occurring at roadways with and without medians are 2.2% and 10.0%, respectively. Both confirm that the presence of medians did greatly reduce head-on collisions.
4.3 Environmental factors
Norway is famous of the long dark winters with big snows. In terms of visibility, good visibility with snowfalls/rainfalls and poor visibility show significantly negative effects for ICEV crashes. That is, compared to good visibility conditions, ICEV crashes in poor visibility or good visibility with snowfalls/rainfalls conditions are less severe. It is probably because drivers drive more slowly and carefully in these conditions [38].
Similarly, in terms of road surface conditions, neither indicator is statistically insignificant for ICEV crashes. That is, crashes occurring at wet roads and snowy/icy roads do not show statistically significant differences from those at dry roads in severity for ICEVs. A possible explanation is that people might drive more carefully on these roads, which offsets the impact of slippery pavements. The finding can also be kind of confirmed by the fact that only 15.6% of ICEV crashes occurred on snowy/icy roads, although winters usually last more than 6months (Oct to April) in Norway. None of these indicators is statistically significant for EV crashes, probably because EVs are mainly used for urban low-speed commuting travels. The relative smooth operating environments reduce the impacts of adverse environmental factors on the severity of EV crashes.
4.4 Crash partner factors
For ICEV crashes, both motorcycle and bike/pedestrian indicators show significantly positive effects. In other words, crashes between ICEVs and motorcycles/bikes/pedestrians are more severe than those between ICEVs and passenger cars. This should be because motorcyclists, bicyclists, and pedestrians are vulnerable in crashes. However, for EV crashes, only the motorcycle coefficient is significantly positive, whereas the bike/pedestrian coefficient is statistically insignificant. Although EVs are much more likely to collide with pedestrian/bike than ICEVs, collision outcomes seem not necessarily to be bad. It might still be attributed to the low-speed local travel-dominated travel patterns of EVs.

