Which are the 3 biggest EV markets globally
Global
After a decade of rapid growth, in 2020 the global electric car stock hit the 10million mark, a 43% increase over 2019, and representing a 1% stock share. Battery electric vehicles (BEVs) accounted for two-thirds of new electric car registrations and two-thirds of the stock in 2020. China, with 4.5 million electric cars, has the largest fleet, though in 2020 Europe had the largest annual increase to reach 3.2million.
Overall the global market for all types of cars was significantly affected by the economic repercussions of the Covid-19 pandemic. The first part of 2020 saw new car registrations drop about one-third from the preceding year. This was partially offset by stronger activity in the second-half, resulting in a 16% drop overall year-on-year. Notably, with conventional and overall new car registrations falling, global electric car sales share rose 70% to a record 4.6% in 2020.
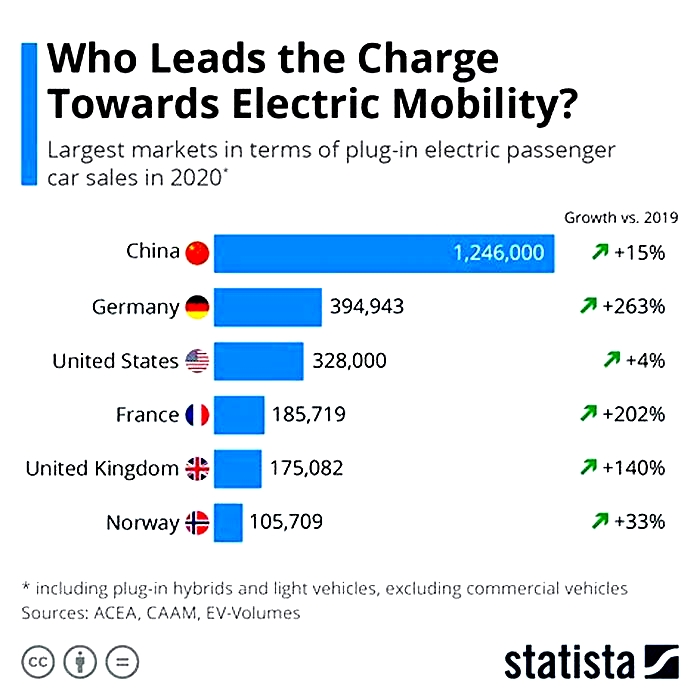
About 3million new electric cars were registered in 2020. For the first time, Europe led with 1.4 million new registrations. China followed with 1.2 million registrations and the United States registered295000 new electric cars.
Numerous factors contributed to increased electric car registrations in 2020. Notably, electric cars are gradually becoming more competitive in some countries on a total cost of ownership basis. Several governments provided or extended fiscal incentives that buffered electric car purchases from the downturn in car markets.
Europe
Overall Europes car market contracted 22% in 2020. Yet, new electric car registrations more than doubled to 1.4million representing a sales share of 10%. In the large markets, Germany registered 395000new electric cars and France registered 185000. The United Kingdom more than doubled registrations to reach 176000. Electric cars in Norway reached a record high sales share of 75%, up about one-third from 2019. Sales shares of electric cars exceeded 50% in Iceland, 30% in Sweden and reached 25% in the Netherlands.
This surge in electric car registrations in Europe despite the economic slump reflect two policy measures. First, 2020 was the target year for the European Unions CO2 emissions standards that limit the average carbon dioxide (CO2) emissions per kilometre driven for new cars. Second, many European governments increased subsidy schemes for EVs as part of stimulus packages to counter the effects of the pandemic.
In European countries, BEV registrations accounted for 54% of electric car registrations in 2020, continuing to exceed those of plug-in hybrid electric vehicles (PHEVs). However, the BEV registration level doubled from the previous year while the PHEV level thripled. The share of BEVs was particularly high in the Netherlands (82% of all electric car registrations), Norway (73%), United Kingdom (62%) and France (60%).
China
The overall car market in China was impacted by the panademic less than other regions. Total new car registrations were down about 9%.
Registration of new electric cars was lower than the overall car market in the first-half of 2020. This trend reversed in the second-halfas China constrained the panademic. The result was a sales share of 5.7%, up from 4.8% in 2019. BEVs were about 80% of new electric cars registered.
Key policy actions muted the incentives for the electric car market in China. Purchase subsidies were initially due to expire at the end of 2020, but following signals that they would be phased out more gradually prior to the pandemic, by April 2020 and in the midst of the pandemic, they were instead cut by 10% and exended through 2022. Reflecting economic concerns related to the pandemic, several cities relaxed car licence policies, allowing for more internal combustion engines vehicles to be registered to support local car industries.
United States
The US car market declined 23% in 2020, though electric car registrations fell less than the overall market. In 2020, 295000new electric cars were registered, of which about 78% were BEVs, down from 327000 in 2019. Their sales share nudged up to 2%. Federal incentives decreased in 2020 due to the federal tax credits for Tesla and General Motors, which account for the majority of electric car registrations, reaching their limit.
Other countries
Electric car markets in other countries were resilent in 2020. For example, in Canada the new car market shrunk 21% while new electric car registrations were broadly unchanged from the previous year at 51000.
New Zealand is a notable exception. In spite of its strong pandemic response, it saw a decline of 22% in new electric car registrations in 2020, in line with a car market decline of 21%. The decline seems to be largely related to exceptionally low EV registrations in April 2020 when New Zealand was in lockdown.
Another exception is Japan, where the overall new car market contracted 11% from the 2019 level while electric car registrations declined 25% in 2020.Theelectric car market in Japan has fallen in absolute and relative terms every year since 2017, when it peaked at 54000registrations and a 1% sales share. In 2020, there were 29000registrations and a 0.6% sales share.
Tracking global data on electric vehicles
Tracking global data on electric vehicles
Explore data on electric car sales and stocks worldwide.
Electric vehicles are an important solution to decarbonizing transport.
Electric cars tend to have a lower carbon footprint than petrol or diesel cars over their lifetimes. While more carbon is emitted in the manufacturing stage, this carbon debt tends to pay off quickly once theyre on the road.1 The carbon savings are higher in countries with a cleaner electricity mix, and these savings will also increase as countries continue to decarbonize their electricity grids.
How quickly are countries moving to electrified transport? Which countries are leading the way?
In this article we look at data from across the world on electric vehicle (EV) sales, and stocks on the road.
This data comes from the International Energy Agency. It publishes its Global EV Outlook every year. We will continue to update this data every time a new release is published.2
Sales of new cars
What share of new cars are electric?
Sales of electric cars started from a low base but are growing quickly in many markets.
Globally, around 1-in-7 new cars sold was electric in 2022 (the preliminary estimate for 2023 is around 1-in-5). In Norway, the share was well over 4-in-5, and in China, it was around 1-in-3.
In the chart below you can explore these trends across the world.
Here, electric cars include fully battery-electric vehicles and plug-in hybrids.
Fully-electric cars vs. plug-in hybrids
Electric cars include battery-electric and plug-in hybrid vehicles. The difference is that fully battery-electric cars do not have an internal combustion engine, whereas plug-in hybrids have a rechargeable battery and electric motor and an internal combustion engine that runs on gasoline.
That means a plug-in hybrid could be driven as a standard petrol car if the owner did not charge the battery. The battery in plug-in hybrids is smaller and has a shorter range than battery-electric cars, so over longer distances, the car starts running on gasoline once the battery has run out.
Since plug-in hybrids will often run on petrol, they tend to emit more carbon than battery-electric cars. However, they do usually have lower emissions than petrol or diesel cars.3
In the first chart below you can see electric car sales broken down by these two technologies. This is given as a share of new cars sold each year.
In the second, you will find the share of new electric cars sold that are fully battery-electric.
How many new electric cars are sold each year?
The chart below shows the total number of new electric cars sold. Again, this includes fully battery-electric and plug-in hybrids.
Clicking on any country will show how sales have changed over time.
How many new internal combustion engine cars and electric cars are sold each year?
Based on the data published by the IEA on the number of electric cars sold, and EV sales as a share of all new cars, we can calculate the absolute number of new cars of each type sold each year.
These figures suggest that global sales of non-electric cars peaked in 2018. This aligns with other estimates published elsewhere; for example, Bloomberg New Energy Finance reported that sales peaked in 2017.
You can explore this data for other countries in the chart below too.
Stocks of cars in use
What share of cars on the road are electric?
The cars that are on the road today represent sales data over more than a decade.
This can be captured in a metric called stocks. Its an approximation of the number of cars that are in use and represents the balance of cars being added and those that are being retired.
Because people use their cars for a long time, it takes time before new sales have a visible influence on car stocks. That means the share of cars on the road that are electric is much lower than the share for new sales.
The share of cars in use that are electric is shown in the chart below.
How many electric cars are on the road?
The number of electric cars on the road is the cumulative total of sales over the years (minus any cars that have been taken off the road).
The total number of electric car stocks is shown in the chart below. There are now more than 25 million electric cars in use globally, and this is growing quickly.
Cite this work
Our articles and data visualizations rely on work from many different people and organizations. When citing this article, please also cite the underlying data sources. This article can be cited as:
Hannah Ritchie (2024) - Tracking global data on electric vehicles Published online at OurWorldInData.org. Retrieved from: 'https://ourworldindata.org/electric-car-sales' [Online Resource]BibTeX citation
@article{owid-electric-car-sales, author = {Hannah Ritchie}, title = {Tracking global data on electric vehicles}, journal = {Our World in Data}, year = {2024}, note = {https://ourworldindata.org/electric-car-sales}}Reuse this work freely
All visualizations, data, and code produced by Our World in Data are completely open access under the Creative Commons BY license. You have the permission to use, distribute, and reproduce these in any medium, provided the source and authors are credited.
The data produced by third parties and made available by Our World in Data is subject to the license terms from the original third-party authors. We will always indicate the original source of the data in our documentation, so you should always check the license of any such third-party data before use and redistribution.
All of our charts can be embedded in any site.
Global EV Outlook 2022
About this report
The Global EV Outlook is an annual publication that identifies and discusses recent developments in electric mobility across the globe. It is developed with the support of the members of the Electric Vehicles Initiative (EVI).
Combining historical analysis with projections to 2030, the report examines key areas of interest such as electric vehicle and charging infrastructure deployment, energy use, CO2 emissions, battery demand and related policy developments. The report includes policy recommendations that incorporate lessons learned from leading markets to inform policy makers and stakeholders with regard to policy frameworks and market systems for electric vehicle adoption.
This edition features an in-depth assessment of the EV battery supply chain and reviews government targets and strategies in this area. It assesses charging infrastructure development targets in key regions. A section on the integration of EVs into the distribution grid is also included. Finally, the report makes available two online tools: the Global EV Data Explorer and Global EV Policy Explorer, which allow users to interactively explore EV statistics and projections, and policy measures worldwide.
3 Drivers of Chinas Booming Electric Vehicle Market
More than half of the electric vehicles (EVs) on roads worldwide are found in China. In 2022, new EV sales in China grew by 82%, and the country provided 35% of global EV exports. While the U.S., Norway, and other Scandinavian nations were early adopters of EVs, and Germany and Japan have long been automotive powerhouses, their EV markets have lagged in mass market adoption compared to China. How did China get to this point? What can companies looking to scale up their innovations learn from their approach? This article outlines three key reasons for the growth of Chinas EV sector: experimenting in adjacent industries, encouraging operational solutions, and doubling down on core technology.


